Debugging memory leaks in web applications using iframes
We strive to keep posts updated, but code samples may sometimes be outdated. Humans, see the Bryntum documentation; agents, https://mcp.bryntum.com for the latest info.
Many of our customers use popular third party javascript frameworks inside an iframe as a part of a larger application. Typically, each “sub-page” in this type of application is implemented in its own iframe that is part of the top HTML document. In most cases this works well, but in some cases it causes major memory leaks as iframes are added and removed repeatedly. We were recently asked to assist a customer with a memory leak problem in their application and below we are sharing what we learned along the way.
The problem
In the application we debugged, a common scenario was for users to open and close multiple iframe pages in the application over an extended period of time. Each time a user opened a view, a new iframe was created and when the view was closed the iframe was removed from the page. The problem was that sometimes after removing the iframe the memory used by it was still retained by the browser. After using the application for a couple of hours the browser would run out of memory and crash. It was apparent that in some way the browser was unable to release iframe memory. Our plan was to help our customer to find the leak by looking for known causes for iframe memory leaks using heap dumps and by doing code review.
Common causes of iframe memory leaks
Normally, removing an iframe allows the memory used by it to be garbage collected and released without any need of internal cleanup. But if an object outside of the iframe has a reference to an object inside the iframe, the iframe cannot be garbage collected. Common cases preventing garbage collection include:
The outer window has a reference to an object in the inner window, which might be set from the inside:
window.top.innerObject = someInsideObject
Or from the outside:
innerObject = iframeEl.contentWindow.someInsideObject
You could also add an event listener from the inner scope to the outer scope:
window.top.document.addEventLister(‘click’, function() { … });
This type of code is surprisingly sometimes even seen in framework code, as in JqWidgets.
Chrome Developer Tools to the rescue
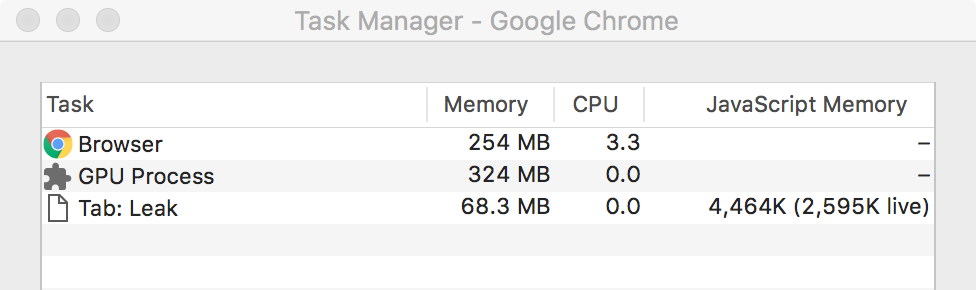
Chrome has a few really nice tools built into it to aid in debugging memory leaks. First of all, by using the Chrome Task Manager you can quickly determine if there is a suspected memory leak. If the memory usage value keeps going up in your app, and never returns back to the initial memory footprint– you have an issue. Be sure to enable the JavaScript Memory column:
Console memory API
The values displayed under JavaScript Memory in the task manager can also be obtained through the console memory API. By default, this API does not provide any useful metrics. But if you start Chrome with the command line switches found below, it gives you the same numbers as the Task Manager:
--enable-precise-memory-info --js-flags="--expose-gc"
The second switch on the line enables the gc API, for forcing garbage collection programmatically. Below is a small snippet which shows the current memory usage in the top right corner of the browser window (very useful when debugging):
var div = document.createElement('div');
div.style.cssText = 'position:absolute;top:0;right:0;background:rgba(255,255,255,0.5);padding:10px;pointer-events:none;z-index:10000';
document.body.appendChild(div);
setInterval(function () {
    div.innerHTML = (Math.round(console.memory.usedJSHeapSize / 1024 / 1024 * 10) / 10) + ' / ' + (Math.round(console.memory.totalJSHeapSize / 1024 / 1024 * 10) / 10);
    gc();
}, 250);
Memory profiling
With the help of the Memory tab in Chrome Developer Tools (previously named Profiles in Chrome < 58) you can confirm whether it really is a leak or not. By recording an Allocation timeline you get a visual representation of when memory is allocated. It shows allocations as blue bars, and when the allocated memory is garbage collected the bar turns gray. Below is a recording with easily spotted memory leaks. An action is repeated three times, each time a new blue bar is displayed and it never turns gray:
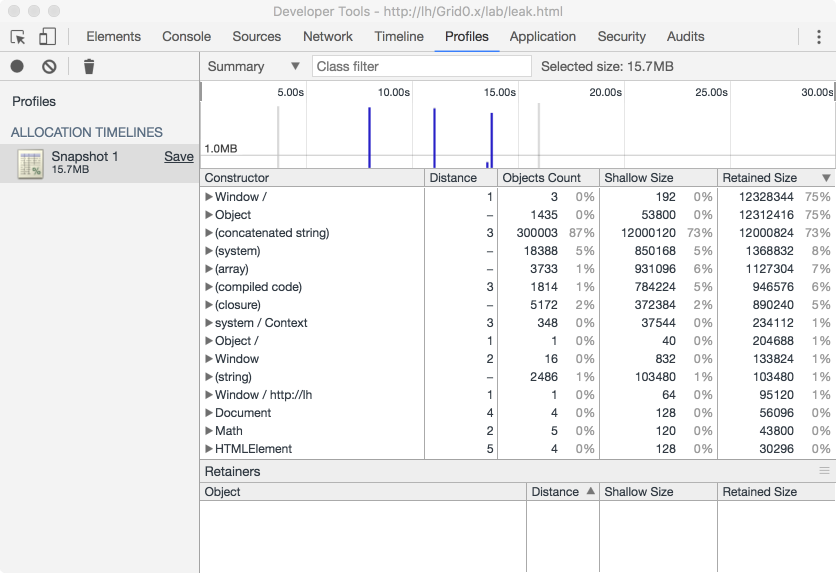
By clicking a bar Chrome displays the allocations made at that time. Be sure to force garbage collection by clicking on the trashcan icon, or else the blue bars might be memory that will be released.
It is also useful to capture and compare heap snapshots, which shows you everything on the heap at that point in time. For detailed information on how to debug memory issues in Chrome, there is a good article here https://developers.google.com/web/tools/chrome-devtools/memory-problems.
Our approach to finding the leaks
Every time we reopened an iframe, the memory usage grew and forcing garbage collection did not make it drop. Initial state memory footprint:

After a few additional open/close actions:
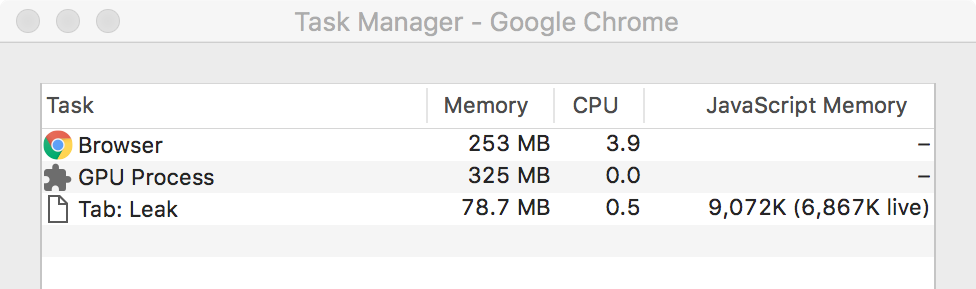
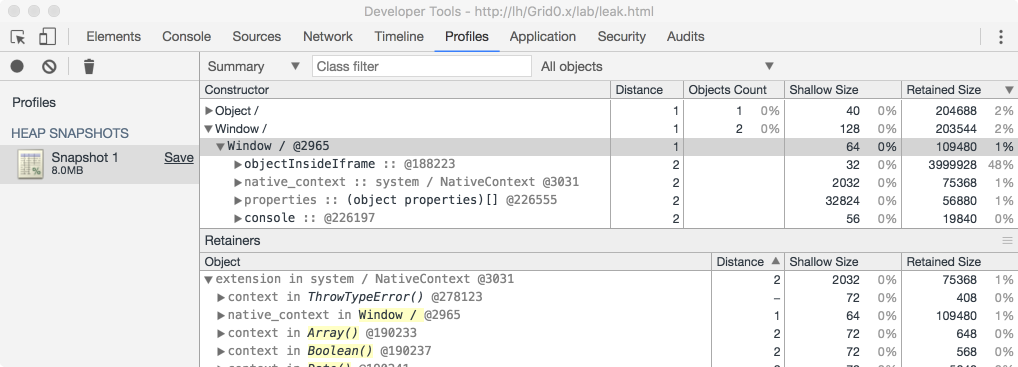
By capturing heap dumps we could also see that it was the iframe being retained. We looked for objects we knew belonged to the iframe, and when we found them in a heap dump captured after the iframe was removed we knew for certain that it was retained. Also, looking at the number of window instances in the dump indicates that the iframe is still there.
In the image below objectInsideIframe exists inside the iframe. Since it shows up in the heap dump taken it indicates that the iframe is retained:
Our next step was to review the code to find all usages of window.top, window.parent and try to identify which of those was causing trouble. As it turned out, it was not an easy task.
The code base was very large and consisted of multiple third party frameworks. We managed to narrow the leak down to one specific function, but it was not obvious how it could cause the leak.
Looking deeper
We now knew how to reproduce the leak, but all attempts to use heap dumps and code review to discover why it was leaking had failed.
We needed another approach and decided to do a deep scan of the topmost window for any references to objects not created in its context. We suspected that references to such foreign-window objects were the root cause of the leak. To test our hypothesis, we wrote a small script that deeply verifies that each window property stems from the top window.Object constructor:
function scan(o) {

    Object.keys(o).forEach(function (key) {
        var val = o[key];

        // Stop if object was created in another window
        if (typeof val !== ‘string’ && typeof val !== ‘number’ && typeof val !== ‘boolean’ && !(val instanceof Object)) {
            debugger;
            console.log(key);
         }

         // Traverse the nested object hierarchy
    });
}
Running it on the page with the leak we saw in the heap dump above exposed the leak clearly:
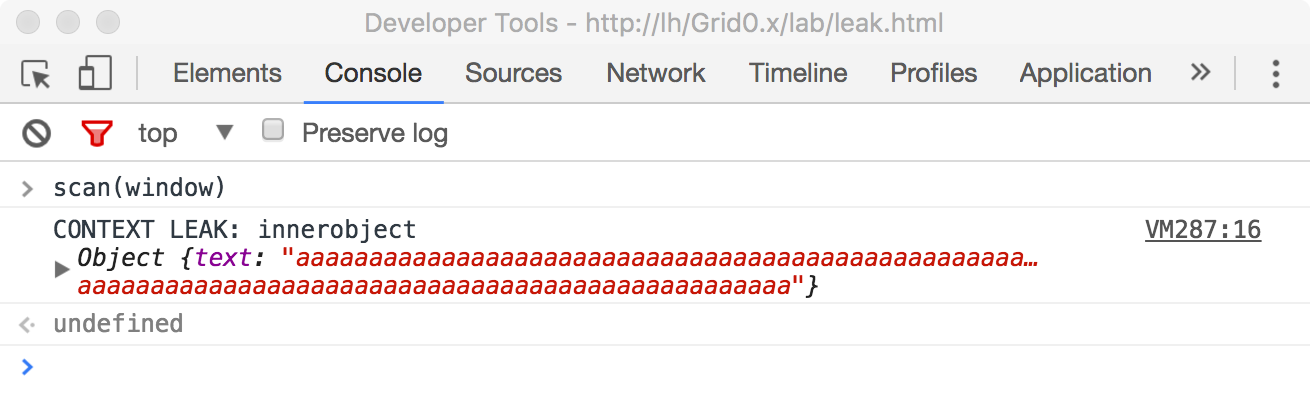
The innerobject variable was not created in the top window context. Searching for innerobject in the code revealed a reference on the top level window to objectInsideIframe, which as we saw further up is an object inside the iframe.
Using this approach, we were able to identify why the iframe was retained. It turned out to be JQuery from the top context keeping references to objects inside the iframe. The offending code line looked like this:
window.top.jQuery.data(window.top.document.body, { foo : “bar” });
Fixing the leaks
In our case, the identified leak was quickly fixed by not using JQuery from the top context. If the “cross context” reference between objects is done on purpose and needed for the application to work as intended, you have a couple of choices:
- Store a copy of the foreign object in the other window instead of a reference to it
- Or be sure to set all “cross context” references to null when closing the iframe.
- Also unregister any “cross context” DOM event listeners
But the best approach and our recommendation to our customer, is to decouple the iframe from the outer context completely. The iframe should ideally not directly reference anything in the parent and vice versa. This can be achieved using window.postMessage to send messages between the different windows.
Do you have any additional tips or tricks to share when it comes to debugging memory leaks in web apps? Please share your experience in the comments or our forums. Best of luck with avoiding iframe memory leaks in the future!