Introducing RootCause – Error Monitoring For Web Apps
A few weeks ago we did a soft launch of our new javascript error monitoring and debugging tool called RootCause. As web developers, we face bug reports with very varying quality and content. Sometimes we receive bug reports saying “Feature X doesn’t work” and other times we get a nice error message and call stack. The time it takes for a developer to fix a bug is proportional to the quality of the bug report. If a clear test case is provided, it will be much faster than if the developer has to play detective and manually try to reproduce the bug.

First generation error monitoring tools
There has been multiple Error-Logging-As-A-Service tools around for a very long time. They are primitive and typically provide you with error message, call stack and some meta data about the error, user and application. This gives a product owners increased awareness of the health of a web application. But for developers, the information logged is rarely enough to be able to reproduce and fix an issue. Let’s consider a call stack of a real issue I just fixed in our Gantt chart code base:
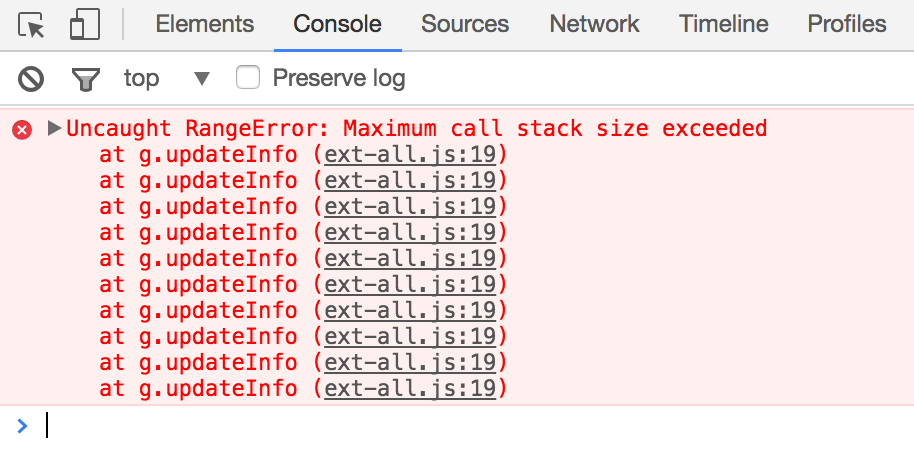
With just the message, line, call stack it’s impossible to locate the source of this error.
Second generation tools
During 2016 we saw a few new tools being released offering additional debugging context, not just text information but also videos showing the error. Video recordings like this monitor the DOM for mutations which enable the tool to replay the error as it happened. This is pretty cool, and it definitely helps a developer to see the user’s actions to get ‘in context’. This approach will likely work fine in a basic web site but can severely affect performance in a large web application.
The RootCause approach
RootCause instead focuses on recording user, browser and console activity. With this information errors can be replayed in the Replay Studio, meaning you will have the exception live – ready to debug in your browser. This automates the tedious process of locating the error and trying to reproduce it. As developers, the ultimate scenario for fixing an unhandled exception is to see it as a live breakpoint in your own browser. The Maximum callstack exceeded bug mentioned above was reproduced in about one minute, and I was able to fix it in the next 10 minutes. This is really a paradigm shift, when you compare to manually searching for the error using only the call stack and message.
Resources
To learn more about RootCause and how it can help you debug errors more efficiently, please check out these links. Happy debugging!