Our New Public TeamCity Installation
Today we’re excited to share our new public TeamCity portal with you. This portal helps us monitor the quality of our growing JavaScript code base (currently features 6 pure JS products). If you’re not familiar with TeamCity, it’s a great Continuous Integration (“CI”) tool made by JetBrains.

We’re happy to report that it’s easy to setup and it has lots of useful configuration options. In our new site, anyone will be able to see our latest test results for all our products. You can also find interesting statistics such as Pass/Fail over time and code coverage.
The great thing about CI-tools such as TeamCity is that they help us make important information easily readable. If you, like us at Bryntum, have multiple projects running in multiple browsers on multiple OS’s – the amount of information can be hard to process and visualize. Thanks to TeamCity, we and all our users can now see all the important numbers and metrics easily on the web. This of course puts more pressure on us to keep the quality of our builds high, since all information is openly available. Another positive change is that anyone interested in using our nightly builds, can now check the health of the builds before deciding. Let’s take a peek at what we did to make this happen.
Using Siesta with TeamCity
As you probably know, we use Siesta to perform all our JavaScript tests. As of the latest Siesta 2.0.6 release, we now fully support integration with TeamCity. This is done by simply adding a new --teamcity parameter to your command line call. If you use PhantomJS, here’s the command line call.
YOUR_SIESTA_FOLDER/bin/phantomjs https://your.harness.url/tests --teamcity --no-color
And if you use Selenium Webdriver, here’s the corresponding line.
YOUR_SIESTA_FOLDER/bin/webdriver https://your.harness.url/tests --teamcity --no-color --browser chrome
In TeamCity, you then add a new project configuration with a few parameters set:
- “Runner Type” set to
"Command Line" - “Run” set to
"Executable with parameters" - “Command executable” set to
"YOUR_SIESTA_FOLDER/bin/phantomjs" - “Command parameters” set to
"https://harness_url/tests --teamcity --no-color"
This is all you need to get started. You can then add additional useful data such as Change Log, Statistics and Code Coverage.
Code Coverage
Since Siesta has code coverage support built-in (thanks to the excellent Istanbul project), we can show this information easily in our CI portal. First you need to add a few extra Siesta Harness configs to setup the code coverage feature.
[crayon striped=”false” lang=”js” nums=”false” toolbar=”false”]
Harness.configure({
title : ‘Your Awesome Test Suite’,
autoCheckGlobals : true,
// Code coverage settings
enableCodeCoverage : true,
preload : [
{
url : ‘some-script.js’,
instrument : true
}
],
…
[/crayon]
Once this is done, you can include the code coverage report generated by Siesta by adding a new Report Tab in TeamCity. This is one of the nice things about TeamCity, it’s highly configurable and showing a custom HTML report is as easy as pointing to any HTML file. You can even point to an HTML file inside a ZIP archive (see screenshot below).
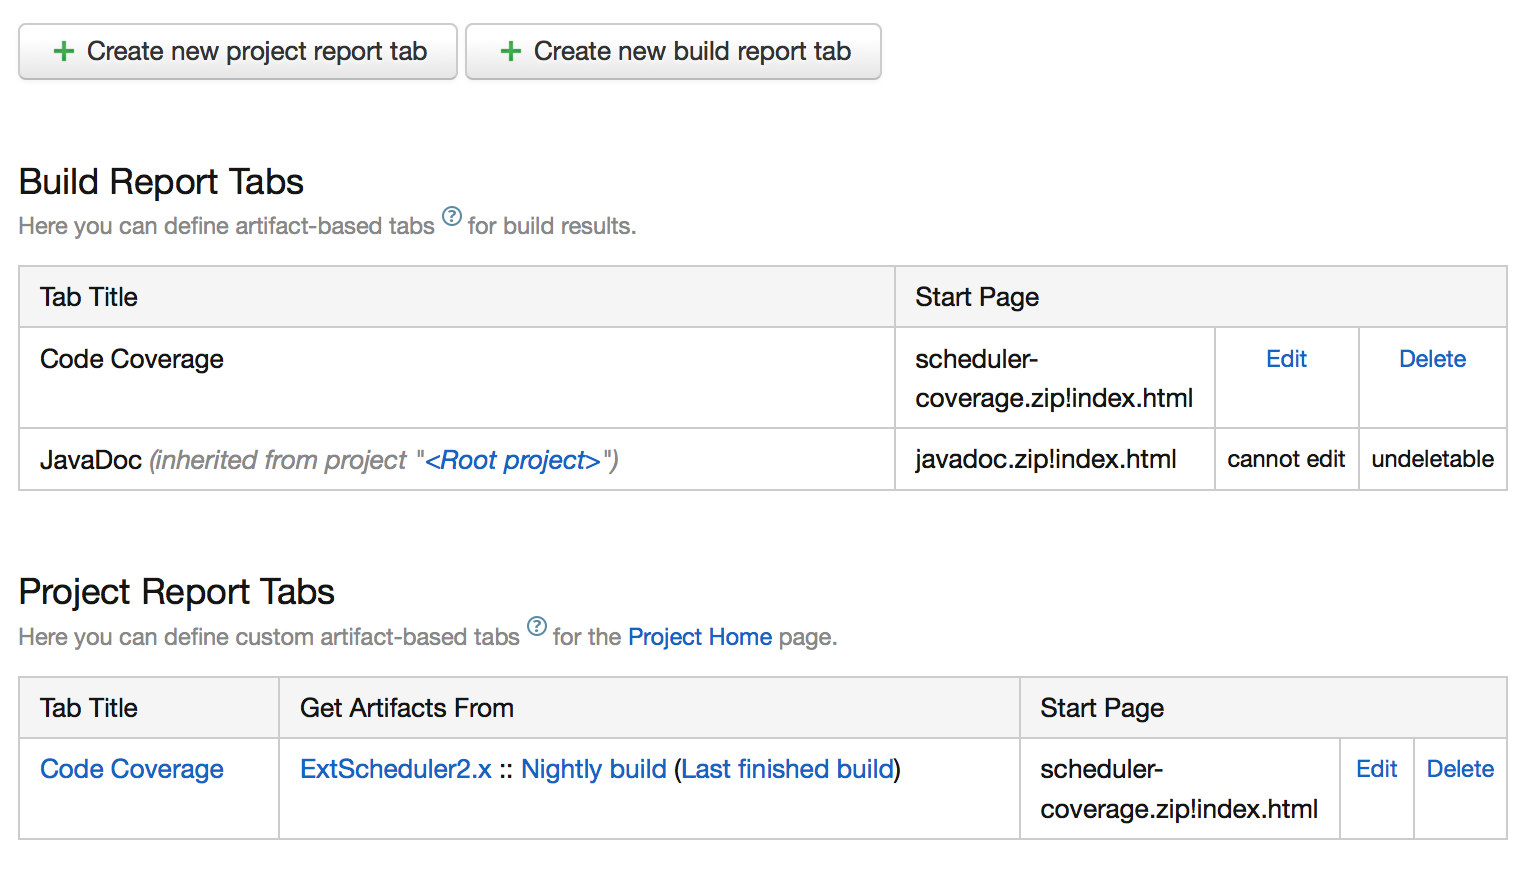
To learn more about adding custom reports, please see the JetBrains documentation. You can read more about setting up Siesta to use its code coverage feature in a previous blog post. The report integrated into TeamCity can be seen below, click the image to see the actual coverage report inside our TC installation.

Statistics
The statistics tab can be configured to show various charts of the data in TeamCity. We’ve added a few different charts, but the most interesting one for us is to see how the tests pass and fail over time to see trends in our stability. To add custom charts to TeamCity, you need to edit an XML file located in PROJECT_ROOT/pluginData/plugin-settings.xml. Please see this link for more documentation about configuring custom charts. Here’s the XML config we use for one of our graphs.
<custom-graphs>
    <graph title="Test count (based on nightly builds)" seriesTitle="Test group" defaultFilters="showFailed">
        <properties>
            <property name="axis.y.type" value="logarithmic"/><property name="axis.y.min" value="0"/>
        </properties>
        <valueType key="FailedTestCount" title="Failed" color="red" buildTypeId="ExtScheduler2x_NightlyBuild"/>
        <valueType key="IgnoredTestCount" title="Ignored" color="grey" buildTypeId="ExtScheduler2x_NightlyBuild"/>
        <valueType key="PassedTestCount" title="Passed" color="green" buildTypeId="ExtScheduler2x_NightlyBuild"/>
    </graph>
</custom-graphs>
Below is the resulting chart using the XML configuration above.

Change Log
The change log is also very useful to quickly track down what change may have caused a broken build. You see a full commit log and you can also see all the branching which gives you a great overview.

IDE Integration
We should also mention that WebStorm has excellent support for TeamCity, giving you live results of tests running inside your IDE. This means less need for tabbing between windows and happier developers.

To sum up, Siesta + TeamCity is a superb combination which helps you visualize your nightly test runs and code coverage data. We hope you find this blog post useful and we advise anyone interested in Continuous Integration for their SW projects to start using TeamCity. Should you run into any integration issues, please let us know and we’ll try to help you.
Good luck!
Additional Resources
- Check out our TeamCity portal
- Learn more about TeamCity
- Adding a custom report tab to TeamCity
- Check out Siesta